 In my past trading days, Bollinger Bands is one of the indicator that I explored to see how I can make money with it. Making money with Bollinger Bands are so simple to use, so intuitive, and so accurate that it always surprises me that a lot Forex traders don’t use them. If you are losing money or looking for a good trading strategy, you should be using Bollinger Bands to really enhance your profit potential, so let’s take look at them.
What is Bollinger Bands?
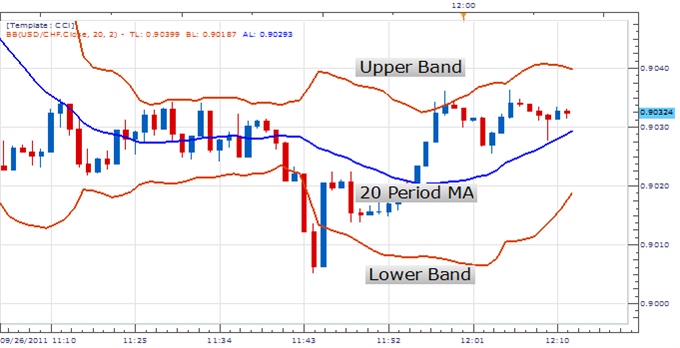
Bollinger Bands is a technique that is created in the 1980s by John Bollinger. It is a guide for traders to see how the future market would go. Each of the line is the predictable range of the moving average. So, the currency pair is expected to trade within these limitations.
Bollinger Bands are volatility indicators. The middle band is a simple moving average of 20 periods, and the upper\lower bands are calculated by adding and subtracting, respectively, the standard deviation of price to the middle band. This means that the difference between the upper and lower band is 2 times the standard deviations. A big space between the two bands means that price is highly volatile, and a small space between the two bands indicates low volatility.

How can we make money with Bollinger Bands?
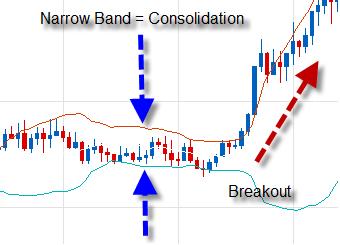
One of the important features of Bollinger Bands is traders are able to tell when a trending move is coming. How do they know? They have to spot an outbreak and new trend by looking for low volatility ranges.
Markets move in between low volatility trading ranges, to high volatility trending moves. Whenever a market trades in a narrow range, the Bollinger Bands will get closer. This shows that the market has become slow with extremely low volatility. Nevertheless this is the sign that a high volatility trending move may follow. When prices break below lower band or above upper band, it is an indication than a breakout and trend move is about to develop. Traders will then create a position in the direction of the breakout, trying to ride the excitement and make money. This trading method is commonly known as the Squeeze.

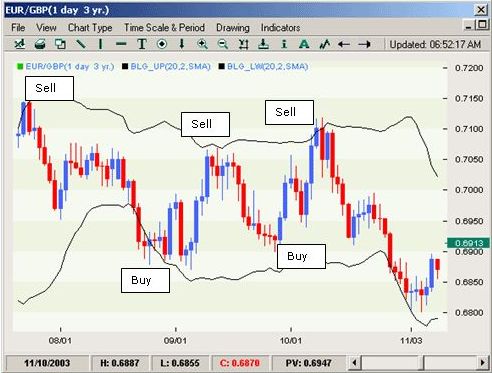
Another widely use of Bollinger Bands among traders is to buy or sell when price touches the lower or upper Bollinger Band respectively and exit when price touches the moving average in the middle band. But, from my experiences, you can also exit when price touches the other side of the band.

Rapid and substantial price moves often tend to happen after the band tightens. Bollinger Bands are often used in conjunction with other technical indicators to detect high probability trend reversal or turning points. The primary indicator that works best with these bands is the RSI (Relative Strength Index), MACD or the CCI ( Commodity Channel Index).
I hope that you find this article helpful. Bollinger Bands are a great tool and if used correctly, it can enhance your trades and increase your profits.
